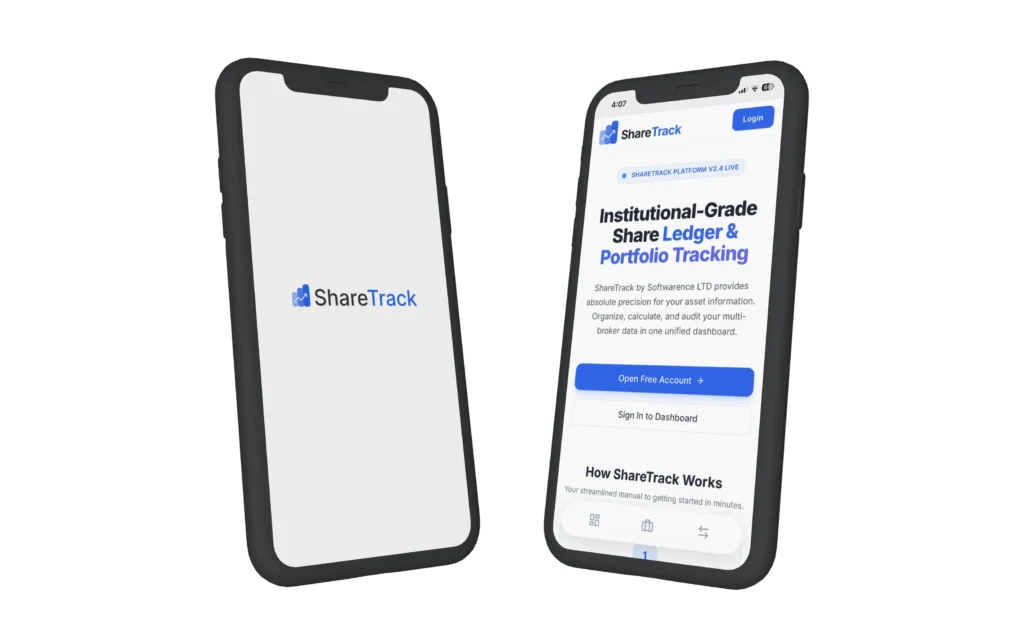
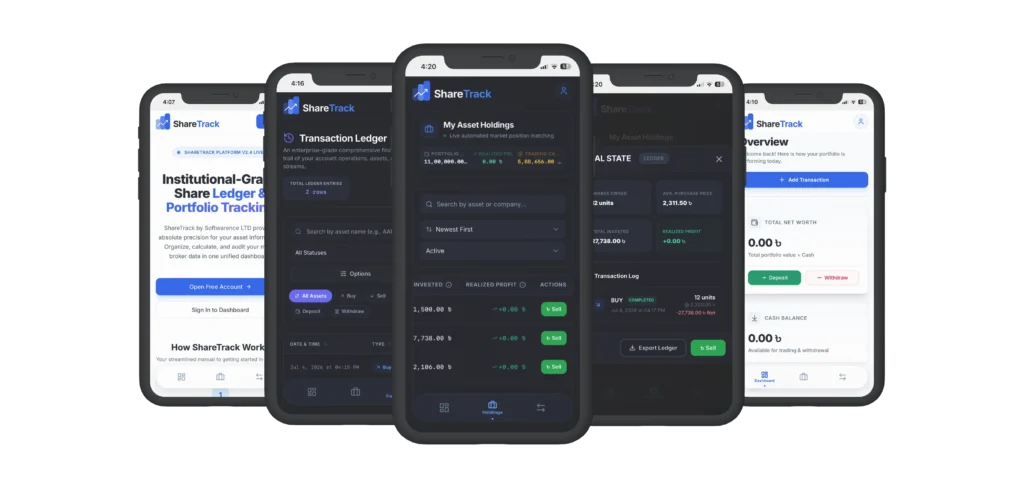
ShareTrack is a minimalist portfolio tracker that gives you an instant overview of your wealth. Track exactly how many shares you own, your total capital invested, and your real-time net revenue or losses on a single, clutter-free dashboard.
Available on
About the app
ShareTrack simplifies how you monitor your assets. The app gives you an instant, accurate count of how many shares you own across your entire portfolio, combined with a precise breakdown of the exact capital you have invested so far.
Designed to eliminate financial clutter, the app calculates your real-time net revenue or losses. It strips away dense market jargon to show you your exact cost-to-profit metrics on a single, easy-to-read dashboard.
Industry
Finance
Platform
iOS, Android & Web
Build time
1.5 months
Problem statement
Retail investors often struggle to track their actual portfolio performance across fragmented platforms, getting bogged down by dense financial jargon and cluttered charts. Without a clear, centralized view, it is difficult to instantly see how many shares they own, exactly how much capital they have invested, and their true net revenue or losses, leading to confused and delayed financial decisions.
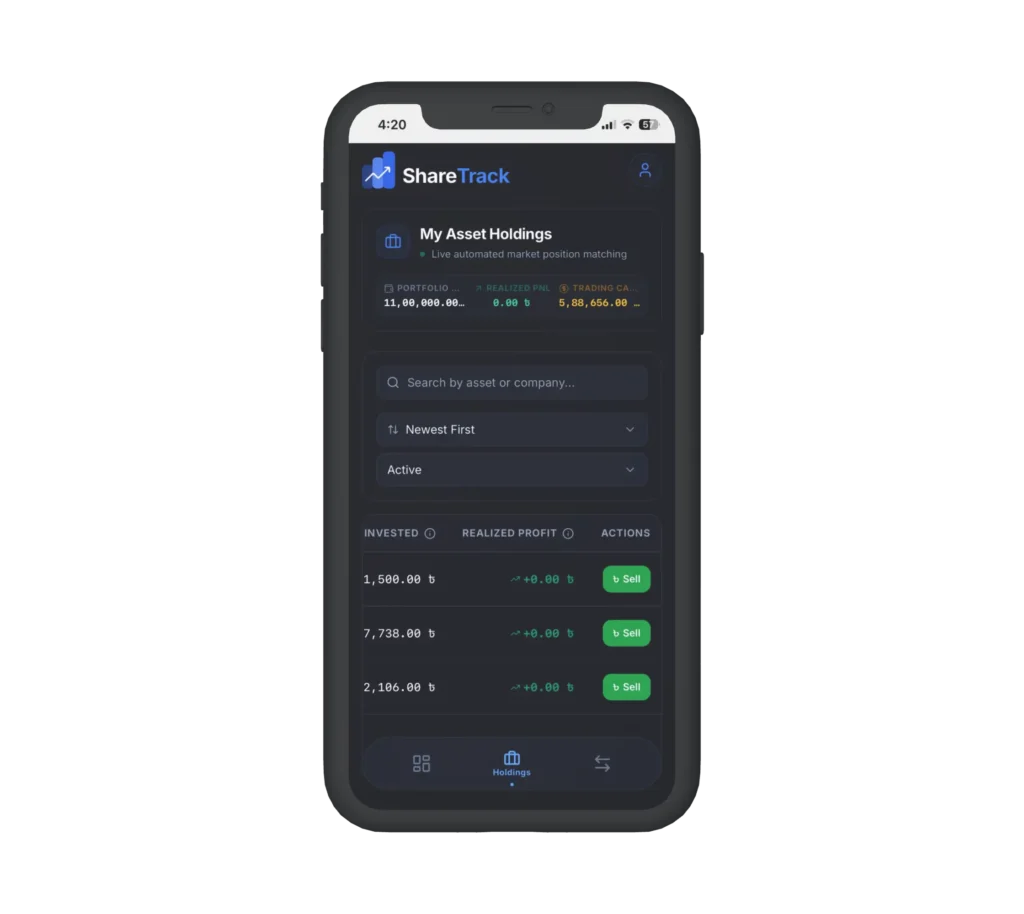
Provide an instant, single-dashboard view showing exactly how many shares a user owns and their total capital invested.
Strip away complex market jargon to display real-time net revenue or losses clearly and transparently.
Replace dense, overwhelming investment charts with a clean, minimalist design focused strictly on essential cost-to-profit metrics.
Workflow Overview
1. Discovery & Research phase
Stakeholder Interviews
Market Analysis
User Persona Development
Feature Prioritization
2. Design phase
Wireframing & Prototyping
UI Design
UX Testing
Branding & Visual Design
3. Development phase
Frontend Development
Backend Development
Payment Gateway Integration
Real-time Communication
4. Testing & Quality Assurance Phase
Unit Testing
Integration Testing
Performance Testing
Security Testing
User Acceptance Testing
5. Deployment Phase
App Store Optimization
Deployment
Monitoring
6. Post-Launch & Maintenance Phase
User Feedback Collection
Bug Fixes & Updates
Feature Enhancements
Customer Support
7. Iteration & Improvement Phase
Continuous Updates
A/B Testing
Data Analytics
Technology setup
The technology setup for Al-Orobah FC utilizes Cross platform development for both iOS and Android to ensure optimal performance and user experience. Backed by a robust backend, real-time support tools, and cloud infrastructure, the platform supports smooth and secure.
Frontend development
Figma
UI/UX design
NextJs
Web app
Backend development
NextJS
Core backend
Database
MongoDB
NoSQL Database
Typography
We selected Inter as the primary typeface for the ShareTrack app due to its clean, geometric sans-serif structure. It strikes the perfect balance between a modern, athletic aesthetic and high digital readability.
Color Palette
#0e172a
Primary
#64748b
Secondary
#2663eb
Accent
Key Features
Core features that define the ShareTrack experience
Challenges & Solutions
Managing personal investments requires processing live market data while keeping the user interface clean and stress-free. Here are the three primary challenges faced during development and how we solved them:
Problems
Real-Time Profit Calculation
Stripping Down Financial Data
Handling Fragmented User Inputs
Solutions
We built a lightweight caching layer that handles asset math on the device. It pulls stock price updates in small, fast batches, giving users instant profit-and-loss feedback without freezing the screen.
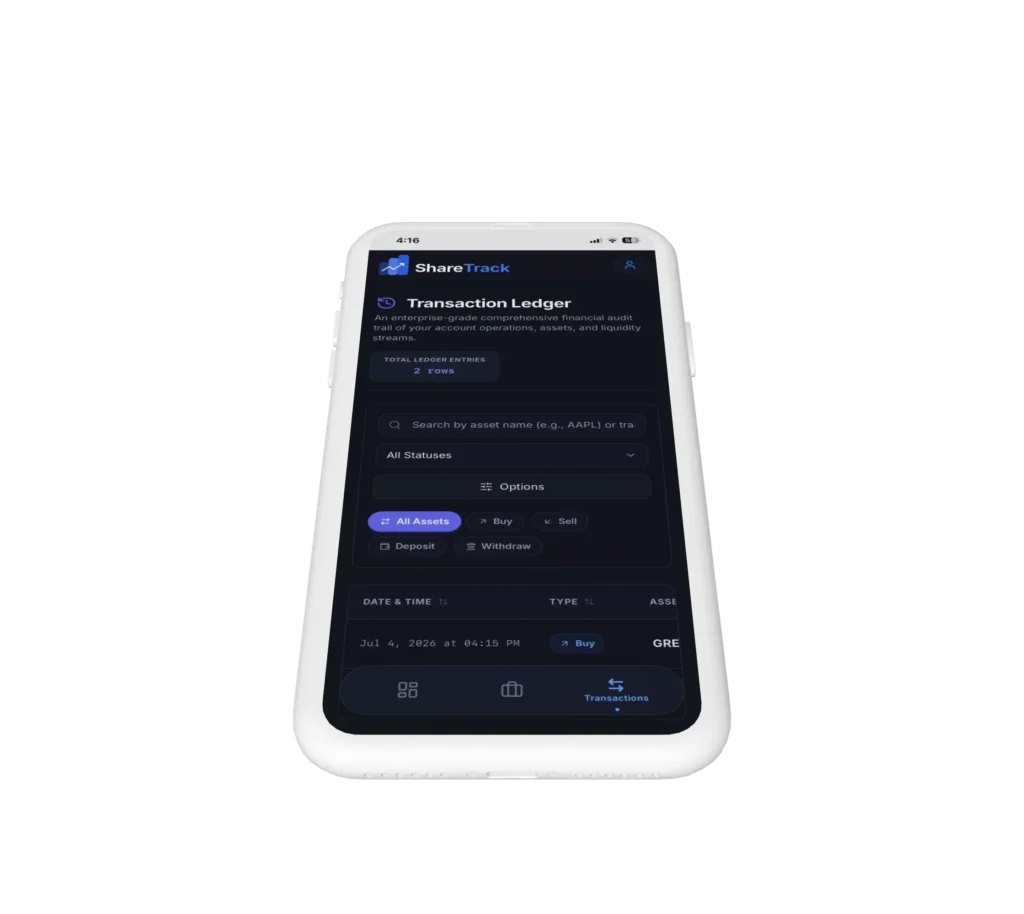
We adopted a strict minimalist design that hides deeper transaction histories behind simple taps. The main screen focuses entirely on three bold, essential numbers for immediate clarity.
We designed an automated smart-input tool. Users just type in their new shares and price, and the app instantly calculates the weighted average cost and updates the portfolio metrics in the background.
Impact and user feedback
User feedback highlighted how a minimalist design can completely transform how everyday investors manage their money. By replacing overwhelming charts with three core metrics—shares owned, total invested, and net profit/loss—the app drastically reduced financial anxiety and helped users understand their true portfolio health in under five seconds.
Every other app forces me to look at confusing charts and moving red lines. ShareTrack just tells me exactly how many shares I have and if I’m up or down today. It’s exactly what I needed.
Liam Vance
Retail Investor
Buying the same stock at different prices used to mean pulling out a calculator to figure out my actual invested capital. ShareTrack handles all the average cost tracking in the background seamlessly.
Sarah J.
Part-time Day Trader
As a UX designer, I appreciate the restraint here. It strips away the financial jargon and highlights net revenue or losses perfectly. It’s the cleanest portfolio tracker on the market.
Marcus Chen
Personal Finance Blogger
Future Improvements
To ensure ShareTrack remains the ultimate stress-free portfolio companion, our roadmap focuses on expanding asset flexibility and adding automated tracking while strictly maintaining our hallmark minimalist design.
Automated Broker Syncing
Integrating secure Open Finance APIs to allow users to link their actual brokerage accounts. This will automatically sync shares owned and new transactions in real time, completely eliminating manual data entry.
Multi-Asset Class Support
Expanding the dashboard to track investments beyond standard stocks. Users will be able to monitor crypto, exchange-traded funds (ETFs), and real estate assets using the exact same clean, simplified capital-to-revenue layout.
Smart Dividend & Payout Tracking
Adding an automated passive income log that tracks upcoming dividend payouts. This feature will show users how much extra revenue their shares are generating over time, integrated smoothly into the main dashboard profit metrics.
Interactive Financial "What-If" Calculator
Introducing a minimalist simulation tool where users can adjust sliders to see how shifting market prices or adding future capital will immediately impact their overall invested total and potential net returns.
Ready to launch app in just a few days. Let’s connect!
We are excited to know about your ideas. We’ll be discussing about your project and help you to boost your business. Schedule a free consultation.